GET TO KNOW THE STEPS FOR MAPBIOMAS BOLIVIA METHODOLOGY
Below you will find the main methodological characteristics of MapBiomas Bolivia for producing land cover and land use maps and transitions between different years.
You can access the ATBD (Algorithm Theoretical Basis Document) with a complete description of the methodology and algorithms by following the link:
DOWNLOAD THE COMPLETE METHODOLOGY - ATBD
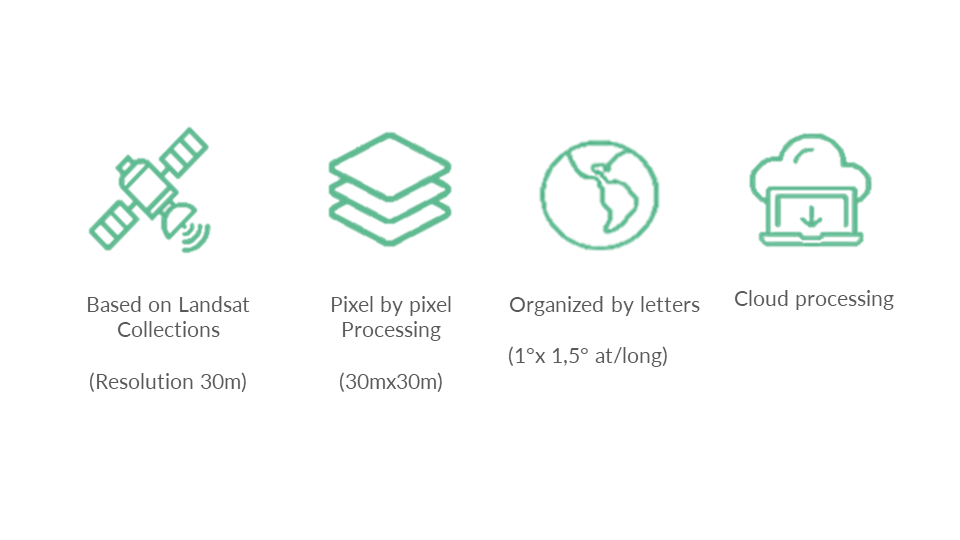
GENERAL CHARACTERISTICS
The annual land cover and use maps of MapBiomas Bolivia were produced from pixel-by-pixel classification of Landsat satellite images. The process is entirely carried out using extensive machine learning algorithms through the Google Earth Engine platform, which offers immense cloud processing capabilities. To facilitate the parameterization of the algorithms and the organization of all processing stages, a total of 230 tiles are used. Each tile has dimensions of 1 x 1.5 degrees (lat/long).
HOW WE ARE ORGANIZED
To carry out the mapping, specialist teams in remote sensing, programming, conservation, and land use are organized by biome and cross-cutting themes.
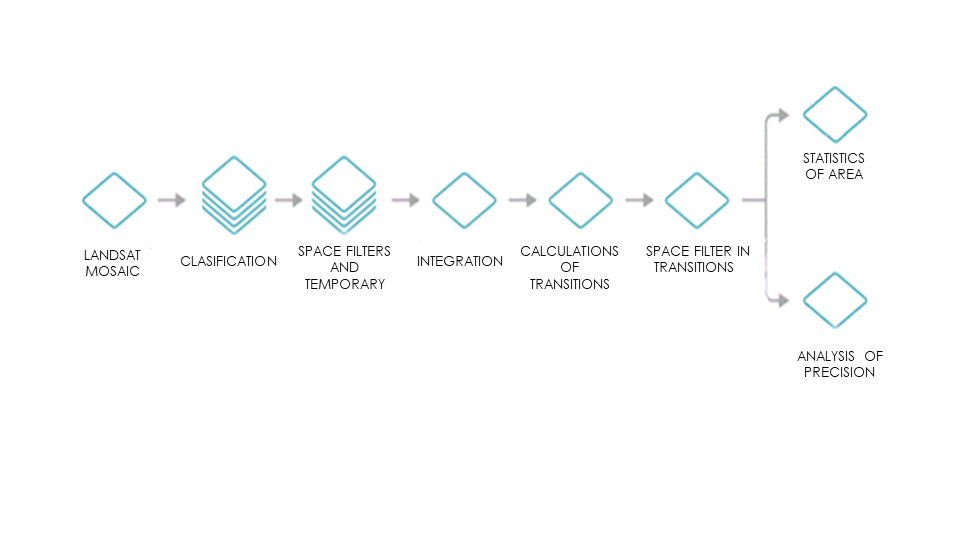
METHODOLOGY OVERVIEW
The diagram below illustrates the main stages of the process for generating annual land cover and land use maps and transitions for MapBiomas Bolivia.